HPIO creates brief analytical pieces to rapidly respond to issues of interest to state policymakers. Below are recent graphics. Click any graphic below to view a larger version. HPIO encourages the use of its graphics in others’ presentations or reports, we just ask that you please cite the Health Policy Institute of Ohio as the source.
click to enlarge
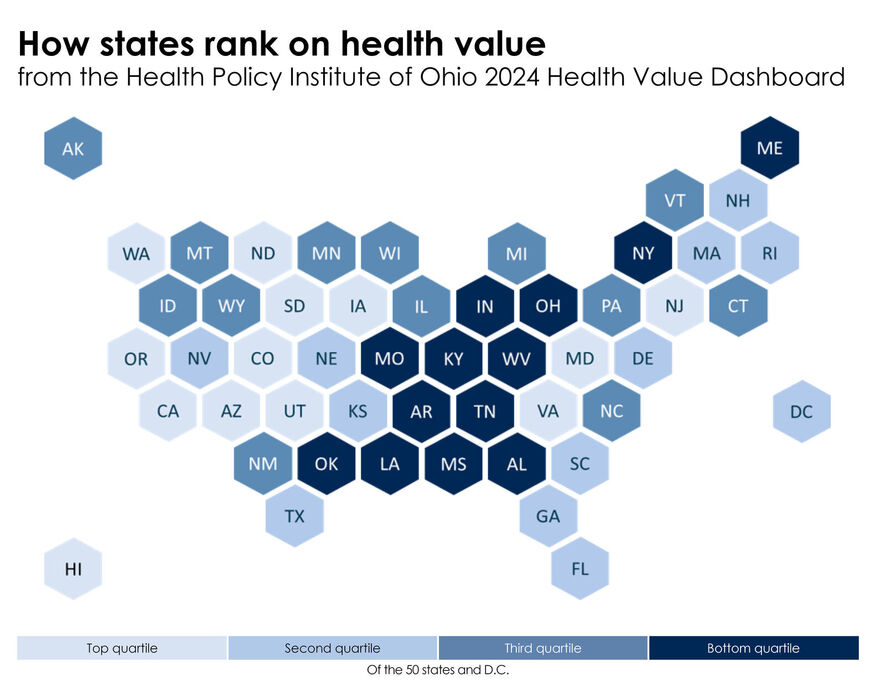
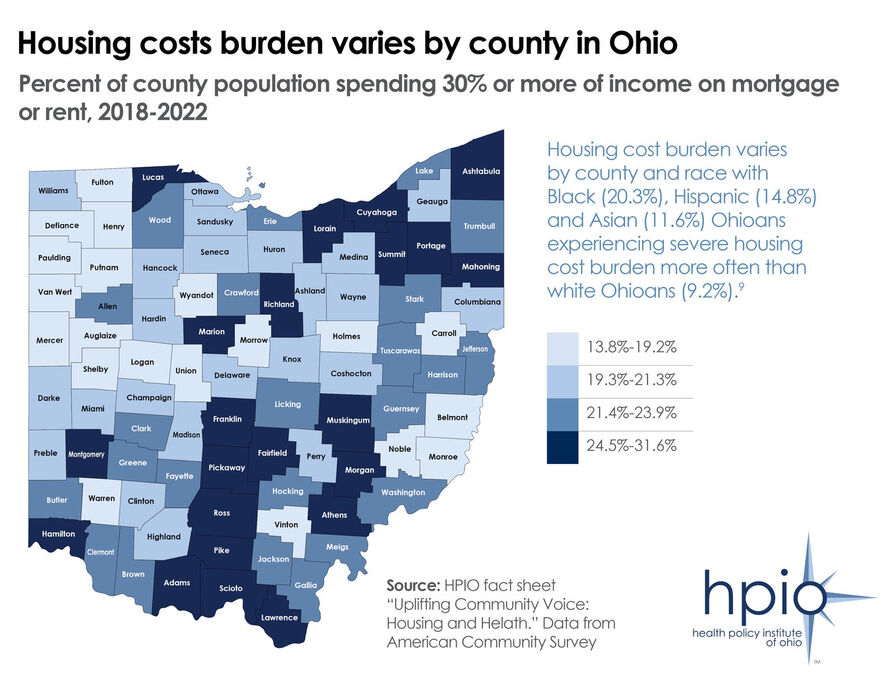
Click for context and resources related to the graphic New analysis from the Health Policy Institute of Ohio found that the number of firearm-involved deaths among Ohio children increased sharply in recent years, as illustrated above. According to data from the Ohio Department of Health’s Ohio Public Health Data Warehouse, there were 104 deaths involving a firearm of children ages 0-17 in Ohio in 2022, or a rate of 4.05 deaths per 100,000 children. That is more than double the rate of 2007, when the death rate was 1.76 per 100,000 Ohio children. What Works for Health, an online tool developed by the University of Wisconsin Population Health Institute to identify evidence-informed health policies, includes a number of potential options that local and state leaders can consider to increase firearm safety for children. click to enlarge Click for context and resources related to the graphic Last month, HPIO released a new Data Snapshot that highlights the prevalence in Ohio of adverse childhood experiences (ACEs) — potentially traumatic events that occur during childhood. Exposure to ACEs —is a pervasive problem affecting many children in Ohio and across the country. ACEs exposure contributes to poor health and well-being throughout life, including disrupted neurodevelopment, social and emotional challenges, disease, disability and premature death. The analysis found that the risk for developing poor health outcomes associated with ACEs increases in proportion to the number of ACEs to which a person is exposed. For example, as illustrated above, Ohioans who have been exposed to two or more ACES are almost twice as likely to report being a current smoker than people who did not experience any ACEs. Starting in 2020, HPIO released a series of policy briefs on the health and economic impacts of ACEs and elevated 12 evidence-informed, cost-effective strategies (program, policies and practices) that can prevent ACEs. click to enlarge Click for context and resources related to the graphic In May, HPIO released the fifth edition of its biennial Health Value Dashboard. The 2023 Dashboard found that Ohio ranks 44th in the nation in health value, a combination of population health and healthcare spending. This means that Ohioans are less healthy and spend more on health care than people in most other states. The Dashboard identified specific areas of strength on which Ohio can build to create opportunities for improved health value in the state. One of those areas is strengthening Ohio’s workforce and reducing poverty by building upon recent success in attracting employers in high-growth industries. Ohio’s workforce is facing serious challenges. As illustrated below, deaths among working-age Ohioans have increased over the last 15 years as labor force participation continues its long-term decline, with Ohio falling behind most other states (For more information, see HPIO’s updated data snapshot “Death Trends among Working-age Ohioans”). However, the state’s strong manufacturing base, strategic location and educational infrastructure has attracted major employers, such as Intel, Honda, Ford and LG Energy Solutions, to invest in the state in the past few years. Ohio is home to 200 corporate headquarters, 14 public universities and 23 community colleges. Further building upon these strengths can lead to a robust workforce that meets the needs of employers, re-invigorates local communities and increase earnings, which will, in turn, reduce poverty and improve health. click to enlarge Click for context and resources related to the graphic Analysis from Healthy Democracy Healthy People (HDHP), a nonpartisan initiative of national public health and civic engagement organizations, has found a two-way relationship between voting and community health. “When we’re healthier, we’re more likely to vote. And communities that vote experience better health,” according to HDHP. HDHP has developed a Health and Democracy Index, which compares public health indicators and voter turnout to restrictiveness of state voting policies. The analysis found that states with more inclusive voting policies and greater levels of civic participation tend to be healthier. As illustrated above, the Index places Ohio among a group of states with worse health outcomes than other states and also more restrictive voting policies. “Democracy makes our communities more inclusive and healthier,” according to HDHP. “Our votes affect health policy, clean air, housing, transit and funding for hospitals. Voting also helps people secure a seat at the table and feel more included within their communities. As Ohioans prepare for the Nov. 7 election, HPIO has created online resource pages for State Issue 1 and State Issue 2. In keeping with its status as an independent and nonpartisan organization, HPIO regularly creates resource pages to make information on the health impact of relevant statewide ballot issues easily accessible to voters. To learn more about voting in Ohio, visit voteohio.gov. Click for context and resources related to the graphic HPIO has released a new Data Snapshot that highlights the prevalence of adverse childhood experiences (ACEs) in Ohio, displays differences in exposure to ACEs for groups of Ohioans and shows how ACEs connect to poor health outcomes. Exposure to ACEs — potentially traumatic events that occur during childhood — is a pervasive problem affecting many children in Ohio and across the country. ACEs exposure contributes to poor health and well-being throughout life, including disrupted neurodevelopment, social and emotional challenges, disease, disability and premature death. In 2021, nearly two thirds of Ohio adults reported having been exposed to ACEs, and nearly half of all adults reported being exposed to two or more ACEs, as illustrated above. Starting in 2020, HPIO released a series of policy briefs on the health and economic impacts of ACEs and elevated 12 evidence-informed, cost-effects strategies (program, policies and practices) that can prevent ACEs. Click to enlarge Click for context and resources related to the graphic Last week, HPIO release a new data snapshot, “Updated Death Trends among Working-age Ohioans,” that found that the number of annual deaths among working-age Ohioans increased 32% from 2007 to 2022, from 25,885 to 34,146. The analysis also found that unintentional injuries, including unintentional drug overdoses and motor vehicle crashes, increased the most from 2007 to 2022 among the leading causes of death, as illustrated above. Cancer is the only leading cause of death that decreased since 2007 for this age group. “These mostly preventable deaths have a tremendous impact on Ohio families, communities and society,” according to the data snapshot. “In addition, the loss of a large number of working-age adults negatively affects Ohio’s economy and businesses.” Click for context and resources related to the graphic Updated analysis from the Health Policy Institute of Ohio found that working-age Ohioans are dying at a much higher rate than they were 15 years ago, despite a drop in deaths in 2022 as the state emerged from the pandemic. The analysis, which is compiled in a new data snapshot, “Death Trends among Working-age Ohioans,” found that the number of deaths among working-age Ohioans increased 32% from 2007 to 2022, from 25,885 to 34,146. If the annual number of deaths had remained constant since 2007, 66,637 fewer working-age Ohioans would have died. “These mostly preventable deaths have a tremendous impact on Ohio families, communities and society,” according to the data snapshot. “In addition, the loss of a large number of working-age adults negatively affects Ohio’s economy and businesses.” The leading cause of death for working-age adults remains unintentional injuries, which included unintentional drug overdoses and motor vehicle crashes. “Unintentional drug overdose deaths continue to play a major role in Ohio’s increased death rate, accounting for 14% of all deaths among Ohioans ages 15-64 in 2022,” the analysis found. The analysis concludes that “There are many effective strategies to address substance use, promote mental health and support access to healthy food and physical activity, all of which can help reduce deaths among working-age Ohioans… Public and private partners can work together to ensure more Ohio workers have the opportunity to live a healthy and productive life.” Click for context and resources related to the graphic Consistent with national research findings and previous HPIO work, new analysis from the Institute finds that Ohioans who reported experiencing more adverse childhood experiences (ACEs) were also more likely to report negative outcomes that contribute to poor health. For example, as illustrated above, the percent of Ohioans who were exposed to two or more ACEs were almost twice as likely to smoke (23%) as those exposed to no ACEs (13%). Similarly, the percent of Ohioans with depression who were exposed to two or more ACEs (34%) was more than three times higher than Ohioans with depression who reported no ACEs (11%). Exposure to ACEs affects many children in Ohio and across the country. National data and analysis provide clear evidence that ACEs exposure is linked to poor health and well-being through adulthood, including disrupted neurodevelopment, social problems, disease, disability and premature death. In addition, ACEs exposure has severe long-term cost implications at the individual and societal levels, including increased medical, child welfare, criminal justice and special education expenditures. However, the negative effects of ACEs can be mitigated. HPIO has presented 12 key strategies to intervene early and prevent the poor health outcomes associated with ACEs. Click here to learn more about HPIO’s Ohio ACEs Impact project Click for context and resources related to the graphic September is National Hispanic Heritage Month, and analysis from HPIO’s 2023 Health Value Dashboard has found that the uninsured rate for Hispanic Ohioans is 2.5 times worse than for white Ohioans, and Hispanic Ohioans are 2.4 times more likely than white Ohioans to be unable to see a doctor due to cost. If disparities were eliminated, 23,892 fewer Hispanic Ohioans would be uninsured and 32,000 fewer Hispanic Ohioans would face cost barriers to seeing a doctor, according to Dashboard analysis. Included in the Dashboard are equity profiles, which explore gaps in outcomes among groups of Ohioans and analyze the barriers to health that contribute to these gaps. “Every Ohioan should have the opportunity to live a long and healthy life, free from environments and experiences that expose them to harm,” the report states. “However, many Ohioans continue to face unhealthy conditions and barriers to health in their homes, schools, workplaces and communities.” Click for context and resources related to the graphic Earlier this summer, public health nonprofit the Truth Initiative released a new report on “Tobacco Nation,” the 12 contiguous states (including Ohio) that have smoking rates that are 50% higher than the national average. This list of states overlaps substantially with the states ranked in the bottom quartile for population health in HPIO’s 2023 Health Value Dashboard. In fact, 11 of the 13 bottom quartile states are part of Tobacco Nation, as illustrated above. Analysis from HPIO has found a strong link between smoking rates and overall population health and healthcare spending. Ohio reports higher rates of adult smoking than most other states (ranking near the bottom at 44th) and Dashboard analysis “found a strong correlation between adult smoking and health value, indicating that tobacco use is a leading driver of poor health and higher healthcare spending.” Previous analysis by HPIO also supports the link between tobacco use, population health and healthcare spending, “States with a lower adult smoking rate are more likely to have a better health value rank— meaning better population health outcomes and lower healthcare spending,” the analysis found. All of HPIO’s work related to tobacco is available on the Institute’s website. Click for context and resources related to the graphic September is National Suicide Prevention Month and new data analysis from the Health Policy Institute of Ohio found that mental health challenges increased for high school students in Ohio during the COVID-19 pandemic, with a particularly striking increase among female high school students. According to data from the Youth Risk Behavior Survey, Ohio high school teens reported increases from 2019 to 2021 in feeling sad or hopeless, seriously considering suicide, making a plan to attempt suicide, attempting suicide and having a suicide attempt that resulted in being treated by a doctor or nurse. However, the increases for female teens were drastically higher than for males, as illustrated above. Attempted suicides among female students increased by 148% between 2019 and 2021, compared to a 51% decrease for males. And attempts resulting in treatment from a medical professional increased 33% for females and dropped 81% for males during the same time period. If you or someone you know needs help, call or text 988 to get in touch with the Suicide & Crisis Lifeline. Click for context and resources related to the graphic Analysis by the Health Policy Institute of Ohio has found that alcohol-involved deaths have continued to increase over the past two decades but have risen dramatically over the last few years (as illustrated above). Alcohol-involved deaths include both deaths caused by long-term alcohol use, such as chronic liver disease and cirrhosis, and acute causes of death, such as alcohol poisoning. September is designated National Recovery Month and state policymakers can use HPIO’s 2021 brief Health Impacts of Excessive Alcohol Use in Ohio to find a list of evidence-based strategies to reduce excessive alcohol use in Ohio, as well as examples of effective strategies for implementation across sectors. According to the brief, “Decades of research have led to a strong understanding of what works to prevent youth drinking, reduce excessive alcohol use, increase access to addiction treatment and reduce alcohol-impaired driving and alcohol-related violence.” Click for context and resources related to the graphic HPIO’s 2023 Health Value Dashboard found that one way health value in Ohio can be improved is by fostering mental well-being. Ohio leaders can build on lessons learned from the response to the addiction crisis over the past decade to make Ohio a national leader in behavioral health. Dashboard data shows that rates of overdose deaths and suicides vary by county (as illustrated above). To support resilience, well-being and recovery in Ohio, the state can target and tailor resources where they are needed most. “Across the U.S. and in Ohio, the toll of behavioral health crises continues to rise, including increases in drug overdose and suicide deaths,” according to the Dashboard. However, the state does have strengths upon which to address the issue. “The state has also improved overall access to care over the past decade, which is an important advantage to getting more Ohioans the help they need.” Click for context and resources related to the graphic HPIO has released a new publication, titled “Strategies to Prevent Adverse Childhood Experiences (ACEs) in Ohio: Building Skills and Strengthening Connections to Caring Adults,” that details the state’s progress in implementing policies that prevent adverse childhood experiences. “Building skills and strengthening connections to caring adults ensures that every child can thrive,” according to the brief. “Enhancing a variety of assets and resources can buffer children and families from the well-documented harmful effects of toxic stress and adversity and promote the ability to withstand, adapt and recover from trauma.” The brief details policies that enhance skills so that parents and youth can handle stress, manage emotions and tackle everyday challenges and connect youth to caring adults and activities. The brief also highlights examples of strategy implementation in Ohio, informed by key informant interviews, and identifies strengths, gaps and recommendations for each strategy. There are many evidence-based parent, caregiver and family skills training programs operating throughout the state. For example, in May 2022, the Triple P Online and Teen Triple P Online programs became available free-of-charge to all Ohio families, granting them access to the programs for one year upon enrollment, through a partnership between the Governor’s Children’s Initiative, Ohio Children’s Trust Fund and the Ohio Department of Job and Family Services. As of June 4, 2023, 10,656 Ohio parents and caregivers had enrolled in one of the programs. The graphic above shows the number of enrollees in each county. In 2020 and 2021, HPIO released a series of policy briefs on the health and economic impacts of ACEs and elevated 12 evidence-based, cost-effective strategies (programs, policies and practices) that prevent ACEs before they happen and improve health. This brief is the second publication in a new series examining those strategies. The first brief in the series details how policymakers can ensure a strong start for children and strengthen economic supports for families. Support for this project was provided by the Harmony Project, the Ohio Children’s Hospital Association and HPIO’s other core funders. Click for context and resources related to the graphic HPIO analysis has found that over the past decade, about 84% of the increase in spending on the Medicaid program in Ohio has been paid from federal funds, with the state accounting for 16% of the increase. As illustrated in the graphic above, between state fiscal years 2012 and 2022, total federal and state spending on Ohio’s Medicaid program grew by an average of 6.7% per year, from about $18.4 billion in SFY 2012 to more than $35 billion in SFY 2022. The analysis was included in HPIO’s Ohio Medicaid Basics, a primer that provides an overview of the Medicaid program in Ohio. HPIO has released Medicaid Basics every two years since 2005. The 2023 edition, which was released in May, includes information on Medicaid eligibility, covered groups and services, delivery systems, financing, spending and recent policy and programmatic changes. Click for context and resources related to the graphic New analysis from HPIO has found that in 2021, 88% of Ohio adults reported that all or most of the time during their childhood, they had an adult in their household who made them feel safe and protected (as illustrated in the graphic above). The data will be included in an HPIO policy brief, the second in a series on strategies to prevent adverse childhood experiences (ACEs) in Ohio, that is expected to be released in August. Nurturing and responsive caregivers — and a safe, stable family environment in which basic needs are met — give children a strong foundation. These are powerful protective factors that can decrease substance misuse, mental health problems and violent and risky behaviors in adolescence and later in life. Also, research has shown that having at least one nurturing, stable caregiver can mitigate the negative effects of ACEs. HPIO has created a recap of its December 2022 forum titled “Preventing ACEs in Ohio: Ensuring a strong start for children and strengthening economic supports for families.” For several years, HPIO has led the Ohio ACEs Impact project, which is informed by a multi-sector advisory group and includes a number of policy briefs, fact sheets and a resource page to build on and amplify current efforts to address ACEs in Ohio. Click for context and resources related to the graphic The Health Policy Institute of Ohio today released new analysis that found that if Ohio eliminated racial disparities, by 2050 the state could gain $79 billion in economic output each year, an increase of 10% over current gross state product. Titled “Unlocking Ohio’s Economic Potential: The Impact of Eliminating Racial Disparities on Ohio Businesses, Governments and Communities,” the analysis is a first-of-its-kind look at the economic potential associated with eliminating racial and ethnic disparities in Ohio, as illustrated in the graphic above. “Beyond the substantial impacts on people and communities of color across Ohio, disparities in outcomes, such as life expectancy and overall health status, represent missed economic opportunities for Ohio businesses, governments and communities,” the report finds. “By eliminating racial disparities, leaders in Ohio can grow the workforce, increase consumer spending, strengthen communities and reduce fiscal pressures on state and local budgets.” The report also includes recommended action steps and examples of how states, counties and municipalities across the country are implementing policies to reduce disparities. “Ohioans of all ages and from all sectors, communities and backgrounds can take meaningful steps to dismantle systemic racism and improve the health and economic vitality of the state,” according to the report. Support for this project was provided by bi3, Interact for Health, The Columbus Foundation and HPIO’s other core funders. Click for context and resources related to the graphic Analysis included in HPIO’s 2023 Health Value Dashboard shows the cyclical connection between health and economic conditions. Improved health of Ohioans leads to greater participation in the workforce and higher earnings, which increases opportunity for better health. As illustrated above, Ohio has experienced a 51% increase in deaths among working-age Ohioans from 2007 to 2021 and the state’s labor force participation has decreased 9% from 2007 to 2022. The Dashboard found that Ohio can address the serious challenges facing its workforce by building upon the state’s strong manufacturing base, strategic location and educational infrastructure that has attracted recent investments from major employers, such as Intel, Honda, Ford and LG Energy Solutions. “Further building upon these strengths — including 200 corporate headquarters, 14 public universities and 23 community colleges — can lead to a robust workforce that meets the needs of employers and reinvigorates local communities,” according to the Dashboard. “With strategic investments in vocational education and work supports, more Ohioans can join the labor force and increase their earnings, which will reduce poverty and improve health.” More information on the topic is available in HPIO’s data snapshot Death Trends among Working-Age Ohioans. Click for context and resources related to the graphic Analysis of data from HPIO’s 2023 Health Value Dashboard shows that Hispanic and Black Ohioans face barriers to health care because of costs. Data shows that Hispanic Ohioans are 2.4 times more likely to be unable to see a doctor due to cost compared to white Ohioans, as illustrated above. Black Ohioans are 1.6 times more likely than white Ohioans to face financial challenges to receiving medical care. If disparities were eliminated in Ohio, 76,449 fewer Hispanic and Black Ohioans would face a cost barrier to accessing care. The Dashboard found that Black and Latino Ohioans often experience worse outcomes than white Ohioans across measures of health, healthcare access and the social, economic and physical environment and that racism and bias are primary drivers of poor outcomes experienced by those groups. These disparities in outcomes lead to missed economic opportunities for Ohio. Next month, HPIO plans to release a new policy brief that will quantify the positive economic impacts of eliminating racial disparities for Ohio businesses, governments and communities. Click for context and resources related to the graphic The Health Policy Institute of Ohio has released an action guide that highlights policy options for improving employment, one of the social drivers of infant mortality in Ohio. HPIO recently produced the Social Drivers of Infant Mortality: Recommendations for Action and Accountability in Ohio report as an update to the 2017 A New Approach to Reduce Infant Mortality and Achieve Equity report. The action guide takes a closer look at the employment recommendations in the Action and Accountability report and provides state and local health stakeholders with additional information and tools to support next steps. “Employment that pays a self-sustaining wage and offers health insurance and other benefits can pave the way for good health and positive birth outcomes,” according to the guide. The action guide highlights policies prioritized by HPIO’s Social Drivers of Infant Mortality Advisory Group. For example, one policy recommendation in the brief is for state and local policymakers to expand paid family leave benefits to 12 weeks or more and eliminate or mitigate the impact of waiting periods to access paid leave for public employees. Sixteen states and the District of Columbia have paid family leave laws, as illustrated above. HPIO recently released similar action guides on housing, education and transportation. In the coming weeks, HPIO plans to release another guide on eliminating racism. The guide and additional tools posted on HPIO’s website can be used to prioritize, advocate for and implement the recommendations. Click for context and resources related to the graphic The Health Policy Institute of Ohio has released an action guide that highlights policy options for improving transportation, one of the social drivers of infant mortality in Ohio. HPIO recently produced the Social Drivers of Infant Mortality: Recommendations for Action and Accountability in Ohio report as an update to the 2017 A New Approach to Reduce Infant Mortality and Achieve Equity report. The action guide takes a closer look at the transportation recommendations in the Action and Accountability report and provides state and local health stakeholders with additional information and tools to support next steps. The guide highlights how transportation affects health and overall well-being in several ways, including by impacting access to care, health behaviors and health outcomes through the ability to get to health care, jobs, school, child care, social services, grocery stores, parks, libraries and other destinations. As illustrated above, Ohioans who are insured through Medicaid face particular challenges with avoiding or delaying care due to a lack of transportation. Earlier this spring, HPIO released similar action guides on housing and education. In the coming weeks, HPIO plans to release guides on employment and eliminating racism. The guide and additional tools posted on HPIO’s website can be used to prioritize, advocate for and implement the recommendations. Click for context and resources related to the graphic With wildfire smoke from Canada causing air quality warnings in many states, data from HPIO’s 2023 Health Value Dashboard shows that Ohio was already lagging behind most other states on metrics related to outdoor air pollution (as displayed in the graphic above). Inhaling polluted air (e.g., wildfire smoke), even in amounts lower than current National Ambient Air Quality Standards, increases the likelihood of poor health outcomes. Longer exposure to polluted air further increases negative health outcomes, which include effects on: Analysis of Dashboard data finds that the physical environment, which includes outdoor air quality, has a stronger correlation with the overall health of a state than access to care. This suggests that improving environmental conditions, like air quality, can improve the health and well-being of Ohioans. Click for context and resources related to the graphic HPIO’s 2023 Health Value Dashboard includes, for the first time, an equity profile for LGBTQ+ Ohioans. Among the data highlighted in the profile is that LGBTQ+ adults in Ohio are much more likely to be diagnosed with depression than their heterosexual and/or cisgender peers, as displayed above. Homophobia and transphobia are primary drivers of poor outcomes experienced by LGBTQ+ Ohioans, the Dashboard states. Experiencing these forms of discrimination can cause toxic stress, leading to poor health outcomes over time. Thus, LGBTQ+ Ohioans often experience worse outcomes than heterosexual and/or cisgender Ohioans across measures of health and the social environment. Policies and practices that limit access to necessary health care and a lack of protections for Ohioans based on sexual orientation and gender identity contribute to worse health outcomes for LGBTQ+ people compared to their heterosexual and/or cisgender peers. As national celebrations begin for Pride Month, it is important to note that there are evidence-informed strategies that Ohio leaders can adopt to improve health disparities for LGBTQ+ Ohioans. By ensuring access to developmentally appropriate care, improving provider education and including sexual orientation and gender identity in anti-discrimination laws, Ohio can close gaps in health outcomes for LGBTQ+ Ohioans. Click for context and resources related to the graphic HPIO has updated data first included in its January Health Value Dashboard policy brief, “A closer look at outdoor air pollution and health.” The updated 2020 data (the most-recent year for which data is available) shows that racial disparities persist in exposure to air pollution, with the index of exposure for Black Ohioans being almost 1.5 times higher than white Ohioans, as displayed in the graphic above. Much of that difference can be explained by historic zoning policies and redlining that placed industrial plants and highways closer to predominantly Black neighborhoods and prohibited Black people from moving to areas farther away from these sources of pollution. These policies increased both past and present risk of exposure to air pollution for Black Ohioans. Similar policy decisions made by federal, state and local officials left Black neighborhoods with less maintenance services (e.g., garbage removal and street cleaning) and without green spaces like parks. Because of these discriminatory policies and their lasting impact, people of color across the U.S. and in Ohio are exposed to higher levels of harmful air pollution. Click for context and resources related to the graphic As stakeholders across the country mark Mental Health Awareness Month, HPIO’s recently released 2023 Health Value Dashboard found that one way health value in Ohio can be improved is by fostering mental well-being. Ohio leaders can build on lessons learned from the response to the addiction crisis over the past decade to make Ohio a national leader in behavioral health. Dashboard data shows that rates of overdose deaths and suicides vary by county (as illustrated above). To support resilience, well-being and recovery in Ohio, the state can target and tailor resources where they are needed most. “Across the U.S. and in Ohio, the toll of behavioral health crises continues to rise, including increases in drug overdose and suicide deaths,” According to the Dashboard. However, the state does have strengths upon which to address the issue. “The state has also improved overall access to care over the past decade, which is an important advantage to getting more Ohioans the help they need.” Click for context and resources related to the graphic The Health Policy Institute of Ohio has released the tenth edition of Ohio Medicaid Basics, a primer that provides an overview of the Medicaid program in Ohio. The 2023 edition includes information on Medicaid eligibility, covered groups and services, delivery systems, financing, spending and recent policy and programmatic changes. In addition to giving an overview of the program, the brief details recent changes, such as Medicaid continuous coverage and redetermination, implementation of the Next Generation of Ohio Managed Care initiative and extension of postpartum coverage, as well as describes how the changes affect enrollment and spending. Ohio Medicaid provides healthcare coverage for about 3.6 million Ohioans (30% of the state’s population, as displayed in the graphic above), most of whom are children, older adults, people with disabilities and adults with low incomes who could not otherwise afford private or employer-sponsored health insurance. The program represents a significant share of government spending in Ohio. In state fiscal year 2022, federal and state expenditures on Medicaid accounted for about 39% of Ohio’s budget, with 73% of the fund coming from the federal government. HPIO has released Medicaid Basics every two years since 2005. Click for context and resources related to the graphic The Health Policy Institute of Ohio has released the latest edition of its biennial Health Value Dashboard, which found that Ohio ranks 44 on heath value compared to other states and D.C. (as displayed in the graphic above). That means that Ohioans are living less healthy lives and spending more on health care than people in most other states. The Dashboard is designed for policymakers and other public- and private-sector leaders to examine Ohio’s performance relative to other states, track change over time and identify and explore health disparities and inequities in Ohio. The report also highlights evidence-informed strategies that can be implemented to improve Ohio’s performance. With more than 100 data metrics, the report can be a valuable tool as Ohio’s leaders continue to develop the state’s biennial budget over the next two months. In the fifth edition of the Dashboard, HPIO identified three specific areas of strengths on which Ohio can build to create opportunities for improved health value in the state: Click for context and resources related to the graphic Five years after HPIO’s report A New Approach to Reduce Infant Mortality and Achieve Equity identified 127 policy recommendations in housing, transportation, education and employment to reduce infant mortality in Ohio, the majority of those policy options saw some progress toward implementation (as illustrated in the graphic above). In March, HPIO released a new follow-up report, Social Drivers of Infant Mortality: Recommendations for Action and Accountability in Ohio, that builds upon recommendations first included in the original report. The new report found that, despite the efforts of many in both the public and private sectors, progress since 2011 in reducing infant mortality has been minimal and uneven, and Ohio’s infant mortality rate remains higher than most other states. In recent weeks, HPIO has released action guides that highlights policy options for improving education and housing, two of the social drivers of infant mortality in Ohio. Guides on transportation, employment and racism are planned to be released in the coming months. Click for context and resources related to the graphic Policy changes made in Ohio over the last decade that have expanded access to care also reduced the gap between Black and white Ohioans who report going without care due to cost, as displayed in the graphic above. As Ohio observes Minority Health Month in April, it is clear that although progress has been made, there is still work to be done to eliminate health disparities. In HPIO’s 2023 Health Value Dashboard, which will be released in late April, the Institute found that if the racial gap in ability to pay for health care was fully closed, nearly 45,000 more Black Ohioans would not experience financial barriers to care. Click for context and resources related to the graphic New data analysis from the Health Policy Institute of Ohio found that while Ohio’s rate of traffic deaths has remained below the U.S. over the past decade, fatalities related to drivers operating a motor vehicle under the influence of alcohol or drugs have increased 78% in the state from 2017 to 2021 (as illustrated in the graphic above). The data also shows a spike in fatalities in both Ohio and the U.S. in 2020, coinciding with the COVID-19 pandemic. According to preliminary research by the federal Department of Transportation’s National Highway Traffic Safety Administration (NHTSA), people who continued to drive during the pandemic may have engaged in riskier behavior including speeding, failure to wear seat belts and driving under the influence of alcohol or other drugs. Ohio ranked 15th in the nation (out of the 50 states and D.C.) in motor vehicle deaths in HPIO’s 2021 Health Value Dashboard. HPIO plans to release its 2023 Dashboard in May. Click for context and resources related to the graphic New data analysis by the Health Policy Institute of Ohio shows that more Ohioans report having high blood pressure than people in other states (as illustrated in the graphic above). The analysis also found that hypertension is more common among Black Ohioans and Ohioans with lower incomes, groups that often experience high rates of chronic stress, a leading contributor to high blood pressure. There is emerging research establishing a link between higher rates of hypertension among African Americans and the chronic stress of discrimination and racism. According to an HPIO policy brief on the connections between racism and health, “chronic exposure to racism renders communities of color more vulnerable to negative health outcomes across the life span and can lead to early death.” The data graphic is the second produced by HPIO in February, which is American Heart Month, a designation designed to spotlight heart disease. Click for context and resources related to the graphic New data analysis by HPIO shows that Ohio has a higher rate of heart disease mortality than most other states (as illustrated in the graphic above). The rate in Ohio is 67% higher than Minnesota, the state with the lowest rate. Heart disease is the leading cause of death in both Ohio and the U.S., according to CDC data. Last year, HPIO released a Data Snapshot on death trends among working-age Ohioans that found heart disease is also the third-leading cause of death among Ohioans ages 15-64. Ohio ranked 42nd in heart disease in HPIO’s 2021 Health Value Dashboard (the 2023 Dashboard is expected to be released in early May). February is American Heart Month, a designation designed to spotlight heart disease. Click for context and resources related to the graphic New analysis from the Health Policy Institute of Ohio, conducted as part of Domestic Violence Awareness Month, found that Ohio children are more likely to witness domestic violence than children in the U.S. overall. In 2020, the most recent year for which data is available, 6.9% of Ohio children witnessed domestic violence, compared to the national average of 5.4% (as displayed in the graphic above). That percentage translates to an estimate of more than 171,000 Ohio children having witnessed domestic violence in their home, according to the National Survey of Children’s Health. Earlier this week, the Ohio Domestic Violence Network reported that 131 people died from domestic violence in the year ending June 30, 2021. That is a 20% increase in fatalities from the year before and a 62% increase from two years prior. Witnessing domestic violence is an adverse childhood experience (ACE) that can cause long-lasting harms that persist throughout life. For more information on ACEs and evidence-informed strategies to prevent them, visit HPIO’s Ohio ACEs Impact Project. Help and resources are available for victims of domestic violence. The Ohio Domestic Violence Network has a help line at 1-800-934-9840 and the National Coalition Against Domestic Violence has an anonymous 24/7 helpline at 1-800-799-7233 (SAFE). The OhioHealth Sexual Assault Response Network of Central Ohio also provides advocacy and emotional support services. Click for context and resources related to the graphic At the conclusion of Suicide Prevention Awareness Month, new analysis from the Health Policy Institute of Ohio details the changing demographic trends in suicide deaths in Ohio (as illustrated in the graphic above). According to data from the Ohio Public Health Data Warehouse, between 2007 and 2021 (the most-recent year in which data is available), suicide deaths increased for both male and female Ohioans, with a greater increase among males. Suicides among Black Ohioans have increased 56% over the past 14 years, compared to a 34% increase for white Ohioans. In terms of age groups, Ohioans ages 25-64 remain the most likely to die by suicide, although rates have increased for all ages since 2007. Earlier this month, HPIO released a graphic illustrating how, between 2007 and 2021, the rate of suicide deaths in Ohio that involved a firearm increased by more than 50% and how, in 2021, suicides involving a firearm accounted for more than all other methods combined. Suicide is preventable and the state’s 2020-2022 Suicide Prevention Plan include evidence-informed strategies that both public- and private-sector leaders can implement to address the issue. September is Suicide Prevention Awareness Month. If you or someone you know is experiencing emotional distress or a suicidal crisis, please call the 988 Suicide and Crisis Lifeline, the Trans Lifeline at 877-565-8860 or the Trevor Project at 866-488-7386. If you don’t like talking on the phone, consider using the Crisis Text Line at www.crisistextline.org or text “4HOPE” to 741-741. Click for context and resources related to the graphic Firearms are the most common method of suicide in Ohio, according to analysis from the Health Policy Institute of Ohio (as illustrated in the graphic above). Between 2007 and 2021 (the most-recent year in which data is available), the rate of suicide deaths in Ohio that involved a firearm increased by more than 50%. In 2021, suicides involving a firearm accounted for more deaths than all other means combined. Suicide is preventable and the state’s 2020-2022 Suicide Prevention Plan include evidence-informed strategies that both public- and private-sector leaders can implement to address the issue. September is Suicide Prevention Awareness Month. If you or someone you know is experiencing emotional distress or a suicidal crisis, please call the 988 Suicide and Crisis Lifeline, the Trans Lifeline at 877-565-8860 or the Trevor Project at 866-488-7386. If you don’t like talking on the phone, consider using the Crisis Text Line at www.crisistextline.org or text “4HOPE” to 741-741. Click for context and resources related to the graphic Newly released data from County Health Rankings show that Black Ohioans have the lowest median household income among groups of Ohioans and have, by far, the highest rate of premature death (years of potential life lost before age 75, which reflects the burden of deaths that potentially could have been prevented). Between 2018 and 2020, Black Ohioans collectively lost 13,374 years of life before turning 75 years old (see graphic above). That is nearly as many years lost as Hispanic (5,858) and white Ohioans (8,224) combined. At the same time, the median household income for Black Ohioans is $12,352 less than Hispanic Ohioans, $28,065 less than white Ohioans and $43,782 less than Asian Ohioans. “Individual efforts alone cannot overcome the structural barriers that maintain the racial wealth divide,” County Health Rankings states. “Structural barriers include laws, policies, institutional practices, and economic arrangements that create unequal conditions.” The latest edition of the County Health Rankings, released this week, includes a new curated list of strategies to address racial wealth building, a key to eliminating health disparities. “Research shows that income inequality has a negative effect on overall population health,” according to the Rankings. “Economically unequal societies often have higher rates of physical and mental illness, violence, and incarceration.” Throughout April, HPIO has marked National Minority Health Month by creating a series of data visualizations to illustrate health disparities in Ohio. Click for context and resources related to the graphic The percentage of Ohioans who are uninsured dropped by almost half from 12.3% to 6.4% between 2011 and 2019 (see graphic above). Every race saw a drop in the percent of uninsured, with the percentage of Asian and Black Ohioans dropping most dramatically compared to other groups. Despite these gains in access, however, Ohioans of color are still more likely to be uninsured than white Ohioans. Much of the drop in Ohio’s uninsured population is attributable to the state’s 2014 decision to expand Medicaid eligibility as part of the Affordable Care Act. In HPIO’s 2021 Health Value Dashboard™, Ohio ranked seventh out of the 50 states and the District of Columbia for access to care — the first time Ohio has ranked in the top quartile on any Health Value Dashboard domain. While access is clearly a bright spot for the state, the Dashboard found that Ohio’s population health outcomes remain poor. Access to care is critical, particularly for Ohioans with serious health conditions. But the Dashboard and national research shows that health is shaped by many factors, including social, economic and physical environments. This April, HPIO is creating a series of data graphics in recognition of National Minority Health Month. Click for context and resources related to the graphic While suicide deaths among young Ohioans have risen overall in Ohio over the past two decades, the increase has been sharpest among Black Ohioans. In 1999, the suicide rates for both white Ohioans and Black Ohioans ages 10 to 24 were the same: 6.8 per 100,000 people. By 2020 (the most recent year for which data is available), the rate for white Ohioans had risen to 11.2 (an increase of 64%) and the rate for Black Ohioans had risen to 12.8 (an increase of 88%). More-recent national research indicates that the disparity in suicide rates may have increased during the COVID-19 pandemic. Reducing suicide and eliminating disparities are priorities of the Ohio Department of Health’s 2020-2022 State Health Improvement Plan (SHIP). Public- and private-sector leaders can implement strategies identified in the SHIP and Ohio’s 2020-2022 Suicide Prevention Plan, including suicide fatality review boards, behavioral health integration with primary care and education on safe storage of lethal means (i.e., firearms and medications). This graphic was created as part of a series for National Minority Health Month. If you or someone you know is experiencing emotional distress or a suicidal crisis, please call the National Suicide Hotline toll-free at 1-800-273-8255. Click for context and resources related to the graphic According to the most-recent data, Black women in Ohio are 2.2 times more likely to die from a cause related to pregnancy and have a 1.85 times higher rate of maternal morbidity (i.e., health problems related to pregnancy and childbirth) than white women. Differences in healthcare access and conditions such as housing, transportation and income, as well as the cumulative impacts of toxic stress and discrimination, all contribute to stark disparities in maternal outcomes across the state. Improving maternal health and eliminating disparities are priorities of the Ohio Department of Health’s 2020-2022 State Health Improvement Plan. This graphic was created to mark the fifth annual Black Maternal Health Week, an event that coincides with National Minority Health Month. Click for context and resources related to the graphic Although the difference in vaccination rates for Black and white Ohioans persists, the gap has decreased in recent months. According to a national study conducted by Harvard researchers, “lack of access to the COVID-19 vaccine among minority populations in the U.S., rather than lower willingness to receive the vaccine, may have played a greater role in the racial-ethnic disparities we experienced in the early phases of the U.S. vaccination campaign.” As of March 31, 57% of white Ohioans and 45% of Black Ohioans had completed vaccines for COVID-19 (two doses of either Pfizer or Moderna or one dose of Johnson & Johnson). That gap in vaccination rates has narrowed from a 29% difference between the two groups in November This graphic was created as part of a series for National Minority Health Month. Click for context and resources related to the graphic Recently released data shows that Ohioans continue to experience substantial financial burdens when paying for housing, and that Ohioans of color are disproportionately impacted. Last year, HPIO released a fact sheet on housing affordability and health equity that described how stable, affordable and safe housing is critical for good health. Above is a graphic from the publication, updated with the most-recently available data. The connections between housing and health are clear. Limited high-quality, affordable housing stock forces many Ohioans into stressful and unsafe housing situations that can lead to long-term negative health consequences, such as high blood pressure and poor birth outcomes. HPIO’s fact sheet “Connections between Racism and Health: State and Local Policymakers,” further explains the connection between racism, housing and health: “Decades of racist housing policies, such as historical redlining and present-day predatory lending practices, have resulted in neighborhood segregation, concentrated poverty and disinvestment from Black communities in Ohio that continue to this day. As a result, Ohioans of color are more likely to experience harmful community conditions — such as food deserts and unsafe, unstable housing — that impact health.” The fact sheet includes action steps policymakers can take to support the health and well-being of Ohioans of color and move Ohio toward a more economically vibrant and healthier future. The fact sheet is one in a series of three that are companions to the HPIO policy brief “Connections between Racism and Health: Taking Action to Eliminate Racism and Advance Equity.” The other fact sheets in the series address private-sector organizations and individuals and community groups. Click for context and resources related to the graphic Both homicides and suicides have significantly increased in Ohio over the past two decades and firearms have been used in a greater percentage of those deaths, new analysis from the Health Policy Institute of Ohio has found (see graphic above). Between 1999 and 2020 (the most-recent year in which data is available), suicide deaths in Ohio increased 49% from 1,102 to 1,644 and homicides increased 123% from 450 to 1,004. The percent of homicides in which a firearm was used has also risen steadily over the past two decades. In 1999, a firearm was used in 57% of homicides, and in 2020 that percentage increased to 82%. In 2020, a firearm was used in 54.9% of suicides.
Released November 10, 2023
Released November 3, 2023
Released October 27, 2023
Released October 20, 2023
Released October 13, 2023
Released October 6, 2023
Released September 29, 2023
Released September 22, 2023
Released September 15, 2023
Released September 8, 2023
Released September 1, 2023
Released Aug. 11, 2023
Released Aug. 4, 2023
Released July 28, 2023
Released July 21, 2023
Released July 14, 2023
Released July 7, 2023
Released June 30, 2023
Released June 23, 2023
Released June 16, 2023
Released June 9, 2023
Released June 2, 2023
Released May 26, 2023
Released May 19, 2023
Released May 12, 2023
Released April 28, 2023
Released April 21, 2023
Released April 14, 2023
Released March 3, 2023
Released February 24, 2023
Released February 17, 2023
Released Oct. 14, 2022
Released Sept. 30, 2022
Released Sept. 16, 2022
Released April 29, 2022
Released April 22, 2022
Released April 15, 2022
Released April 8, 2022
Released April 1, 2022
to a 23% difference as of this week (see graphic above).
Released March 25, 2022
Released March 18, 2022