Ohio Medicaid basics update: Recent trends in enrollment and spending
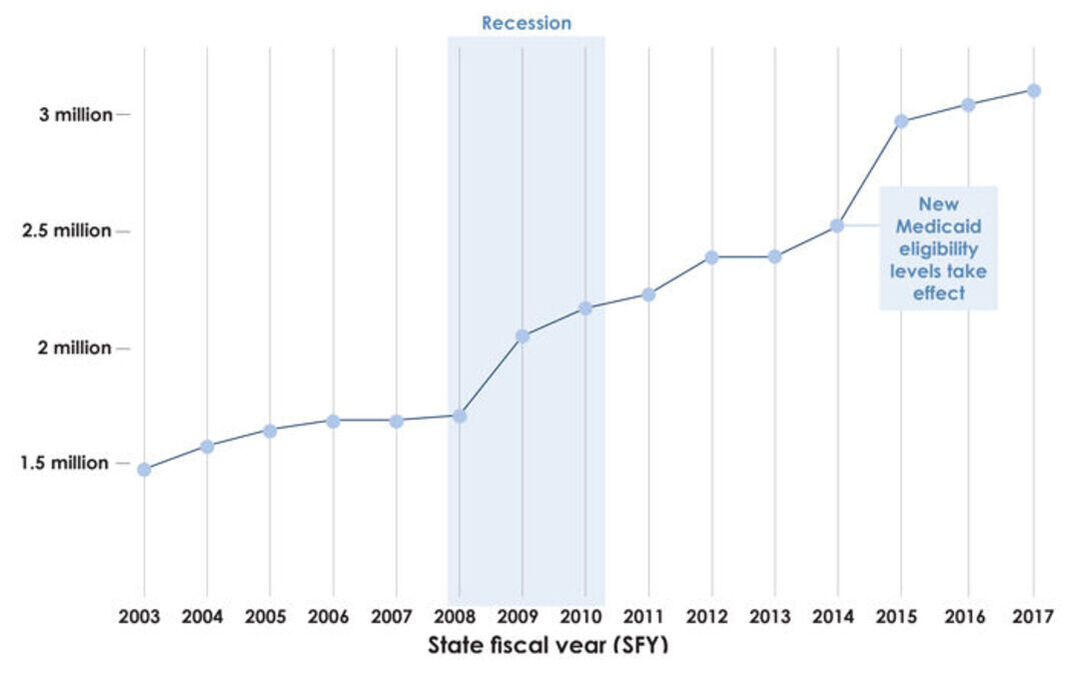
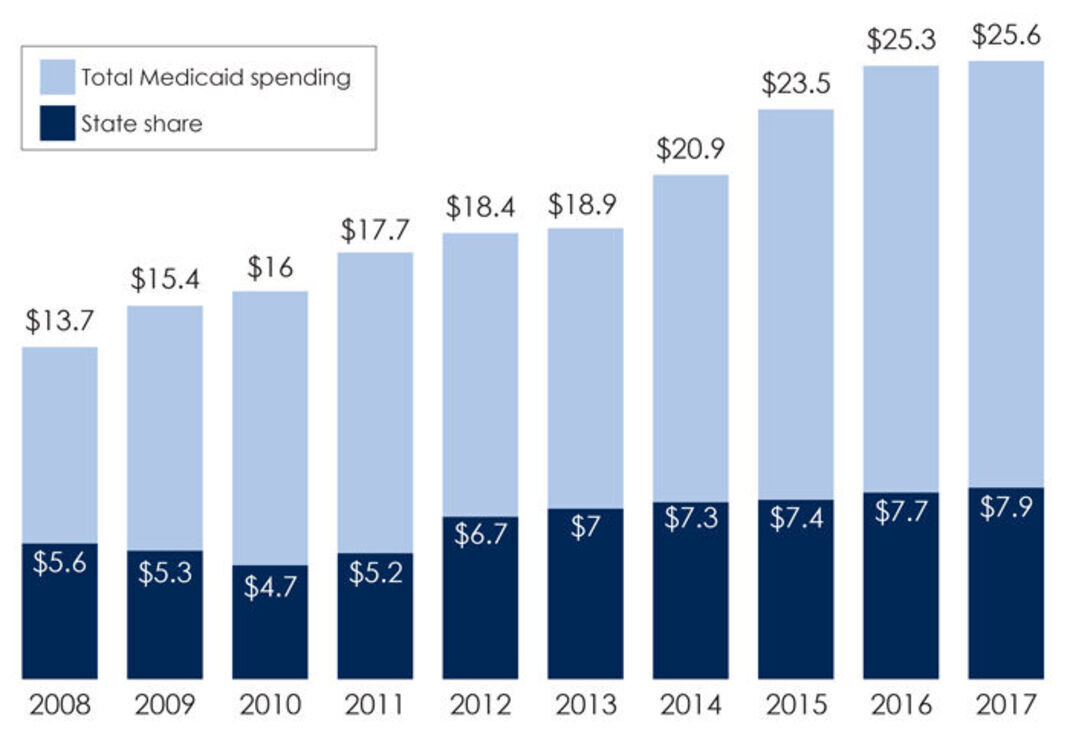
The brief is an update to HPIO’s biennial publication, Ohio Medicaid Basics 2017. The publication provides new data about enrollment and spending during SFYs 2017 and 2018 and describes connections between enrollment and spending growth (See figures 1 and 4 from the brief below) in Ohio’s Medicaid program.
Overall, the report found that Medicaid enrollment appears to be stabilizing and per member per month spending growth has averaged 1.6 percent since SFY 2015, within the limits set by the General Assembly’s Joint Medicaid Oversight Committee. Many opportunities remain for Ohio to invest in evidence-based policies that prevent health conditions and address root causes of poor health and costly care. Strategic investments and a commitment to continual evaluation could lead to sustainable spending growth and improved health outcomes.
Policy and process changes related to the Aged Blind and Disabled (ABD) eligibility group implemented during state fiscal year 2017 increased ABD enrollment. This trend is likely to continue as older adults are projected to make up a larger proportion of Ohio’s population. Since people enrolled in the ABD category generally have more healthcare needs and higher healthcare costs than other groups, Ohio’s changing demographics will impact future Medicaid spending.
The federal government, Ohio and other states have pursued strategies to reduce Medicaid spending growth, while ensuring that people with low incomes have access to care. Often these strategies focus on high cost, high need populations. Many new models of payment and care coordination have emerged, with variations in results. Over the past several years, Ohio has focused on transitioning most groups to managed care and advancing patient-centered primary care and episode-based payments.
Going forward, Ohio could build on these efforts by furthering effective, comprehensive coordinated care models that tie payment to population health outcomes and include a shared savings component. The state could do more to prevent high-cost conditions, such as by supporting the Diabetes Prevention Program and tobacco cessation, and other evidence-based policies that address behaviors and the social determinants of health as outlined in the 2017-2019 State Health Improvement Plan.
Figure 1. Ohio Medicaid enrollment trend, 2003-2017
Figure 4. Ohio Medicaid spending, in billions, SFY 2008-2017

Note: ODM caseload reports update each month to reflect retroactive and back-dated eligibility. SFY averages for 2012-2017 were retrieved from the January report for the end of the fiscal year. Sources: 2003 – 2011 Ohio Department of Job and Family Services, Public Assistance Monthly Statistics reports; 2012-2017 Ohio Department of Medicaid (ODM), caseload reports

Source: Data from Ohio Legislative Services Commission, Historical Revenues and Expenditures table 4

