Water Quality in Ohio
Water quality and health
Graphics
To use the data graphics in your presentations, click here to access the slides on Google Drive, click “File” and then “Download.” This will allow the option to download individual slides or the full deck into PowerPoint slides, a jpg, pdf or other available media files.
Data points
Note: This publications was published in March 2024. For most-recent data, consult the data sources at the end of the publication.
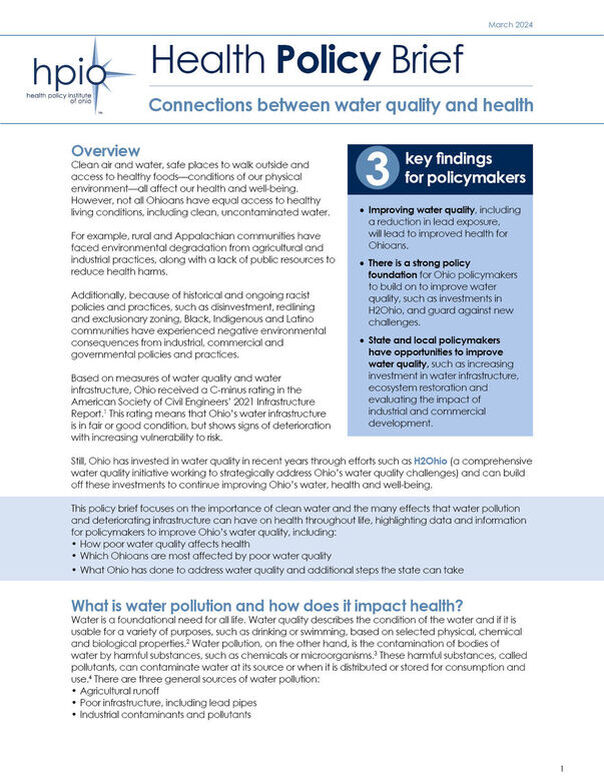
Connections between water quality and health
Key data findings
- In 2021, 2.4% of homes across Ohio (124,761 homes) lacked hot and cold running water and/or a bathtub or shower. This challenge was worst in Appalachian counties (4% without complete access).
- The U.S. EPA estimated in September 2023 that Ohio had at least 369,077 lead service lines, but could have as many as 745,061 lead lines, putting Ohio among the states with the highest amount of lead lines.
- Policy changes in sewage collection and treatment and soil conservation have led to a significant increase in the amount of Ohio rivers meeting water quality standards (89% meeting or exceeding standards in 2020-2021 compared to 18% in the 1980s).
Suggested citation: Health Policy Institute of Ohio. “Connections between water quality and health,” March 2024.

